Blog
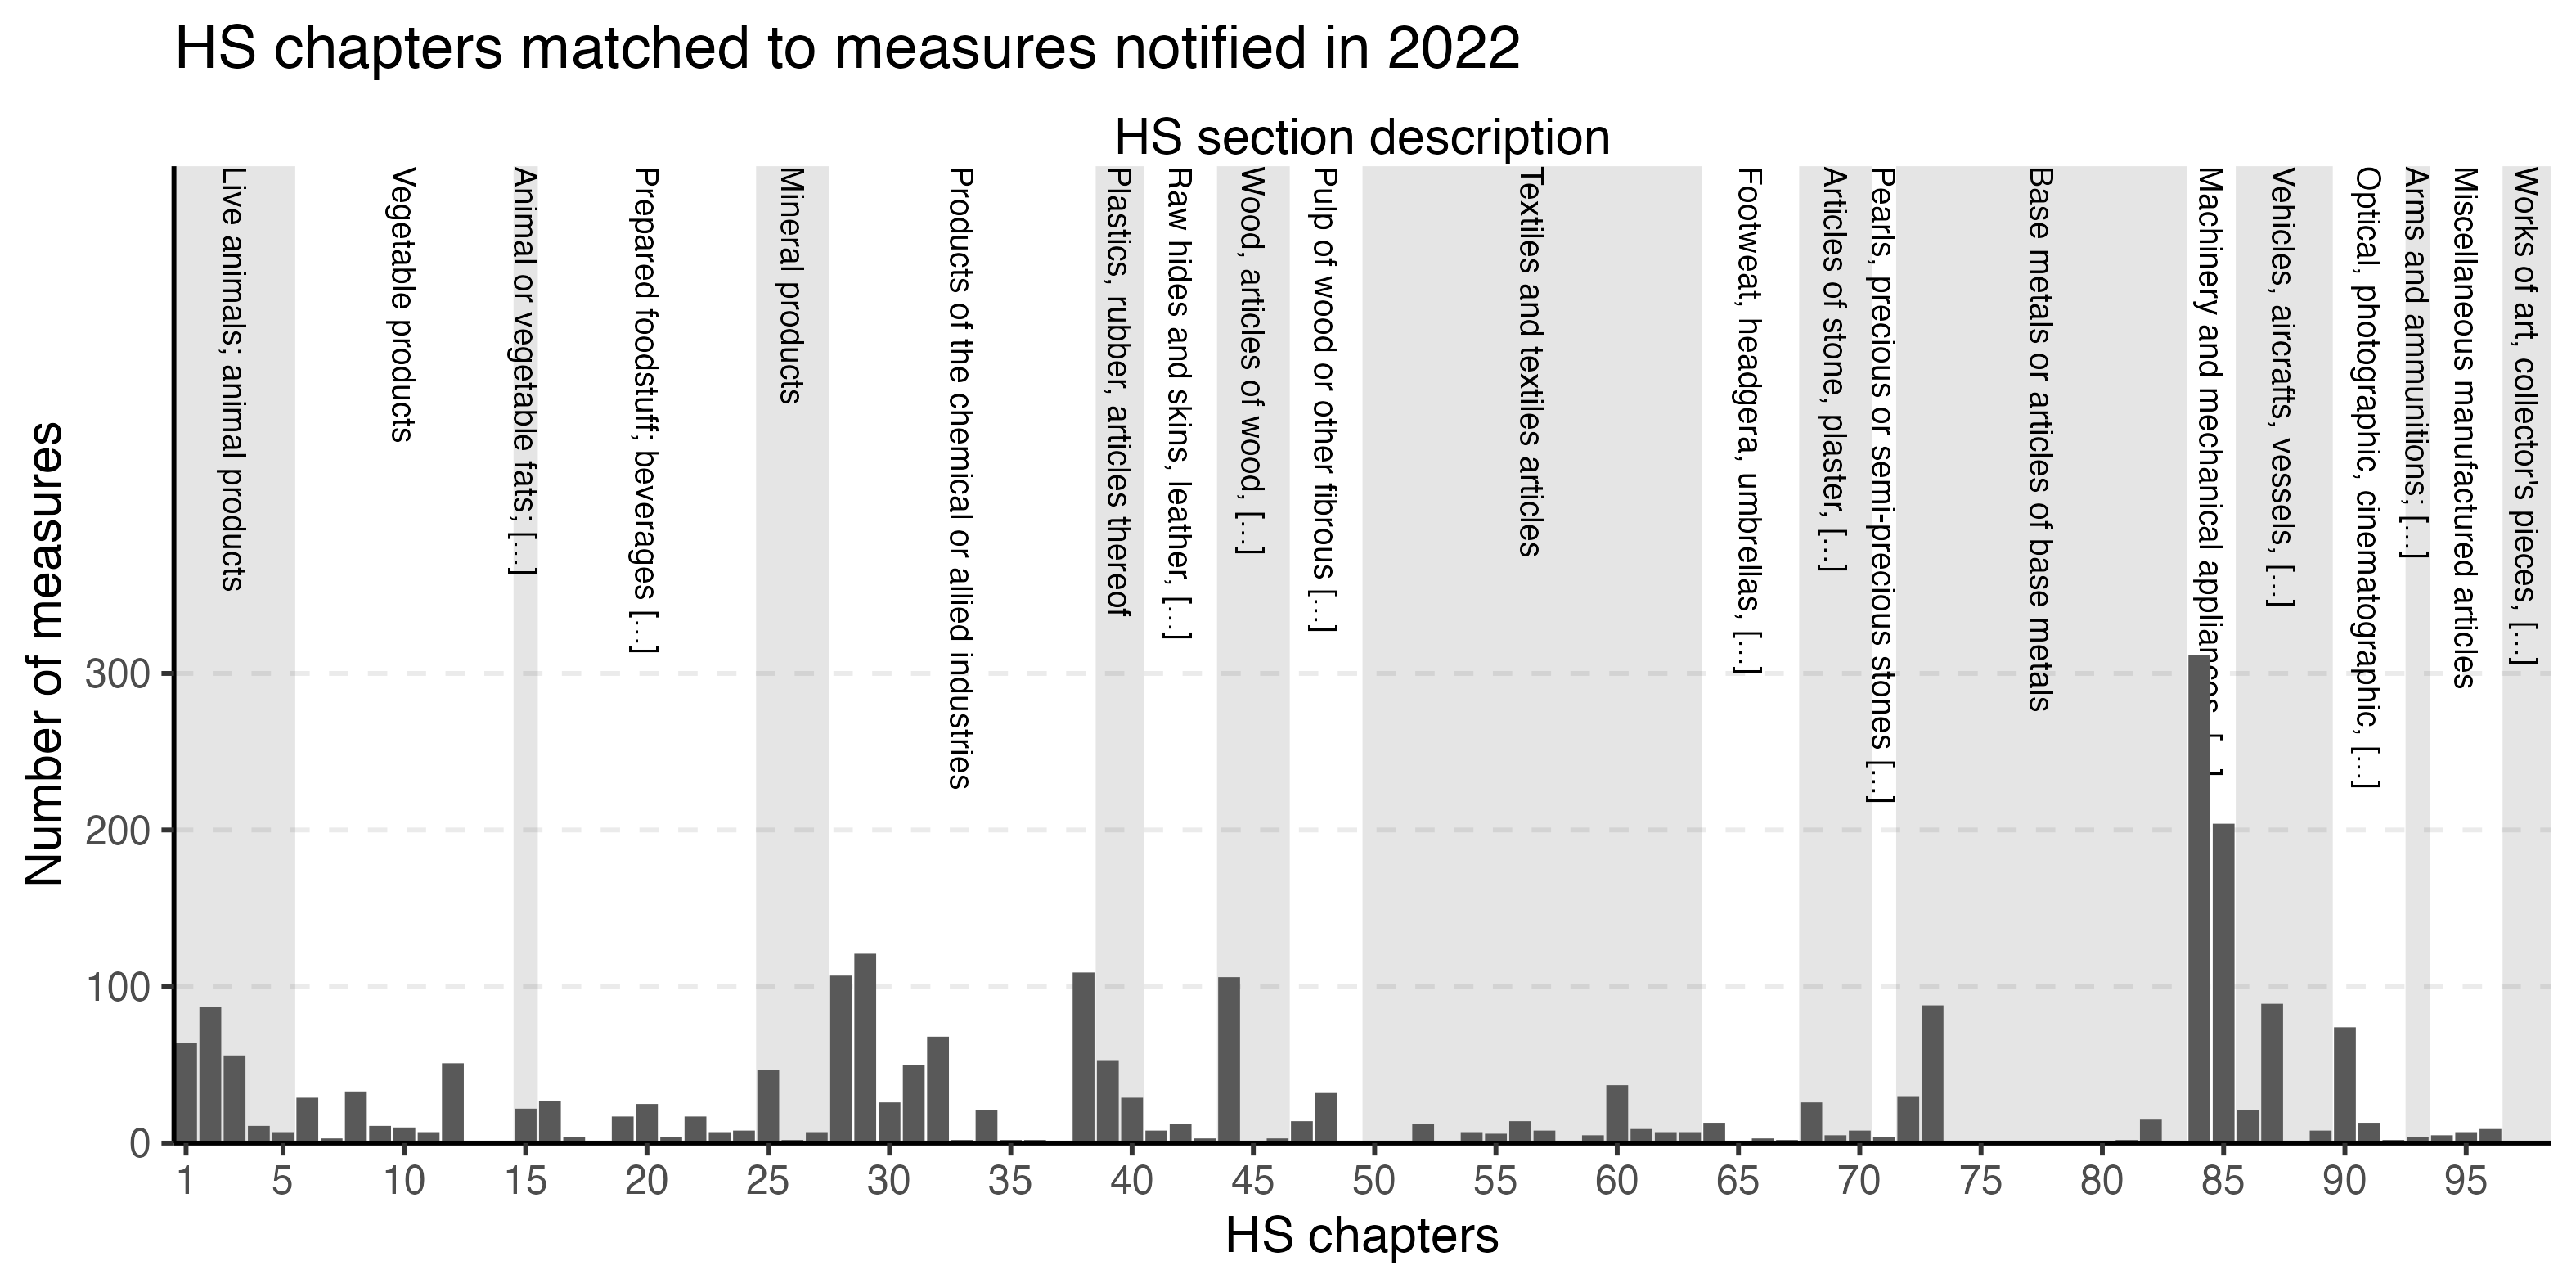
New EDB extension release
The environmental measure dataset has been updated to cover the policies notified to WTO up to 2022.

The package countries is now on CRAN
After a year of development, I am happy to annouce that my package can now be downloaded directly from R's official repository. And it has some cool new functionalities!
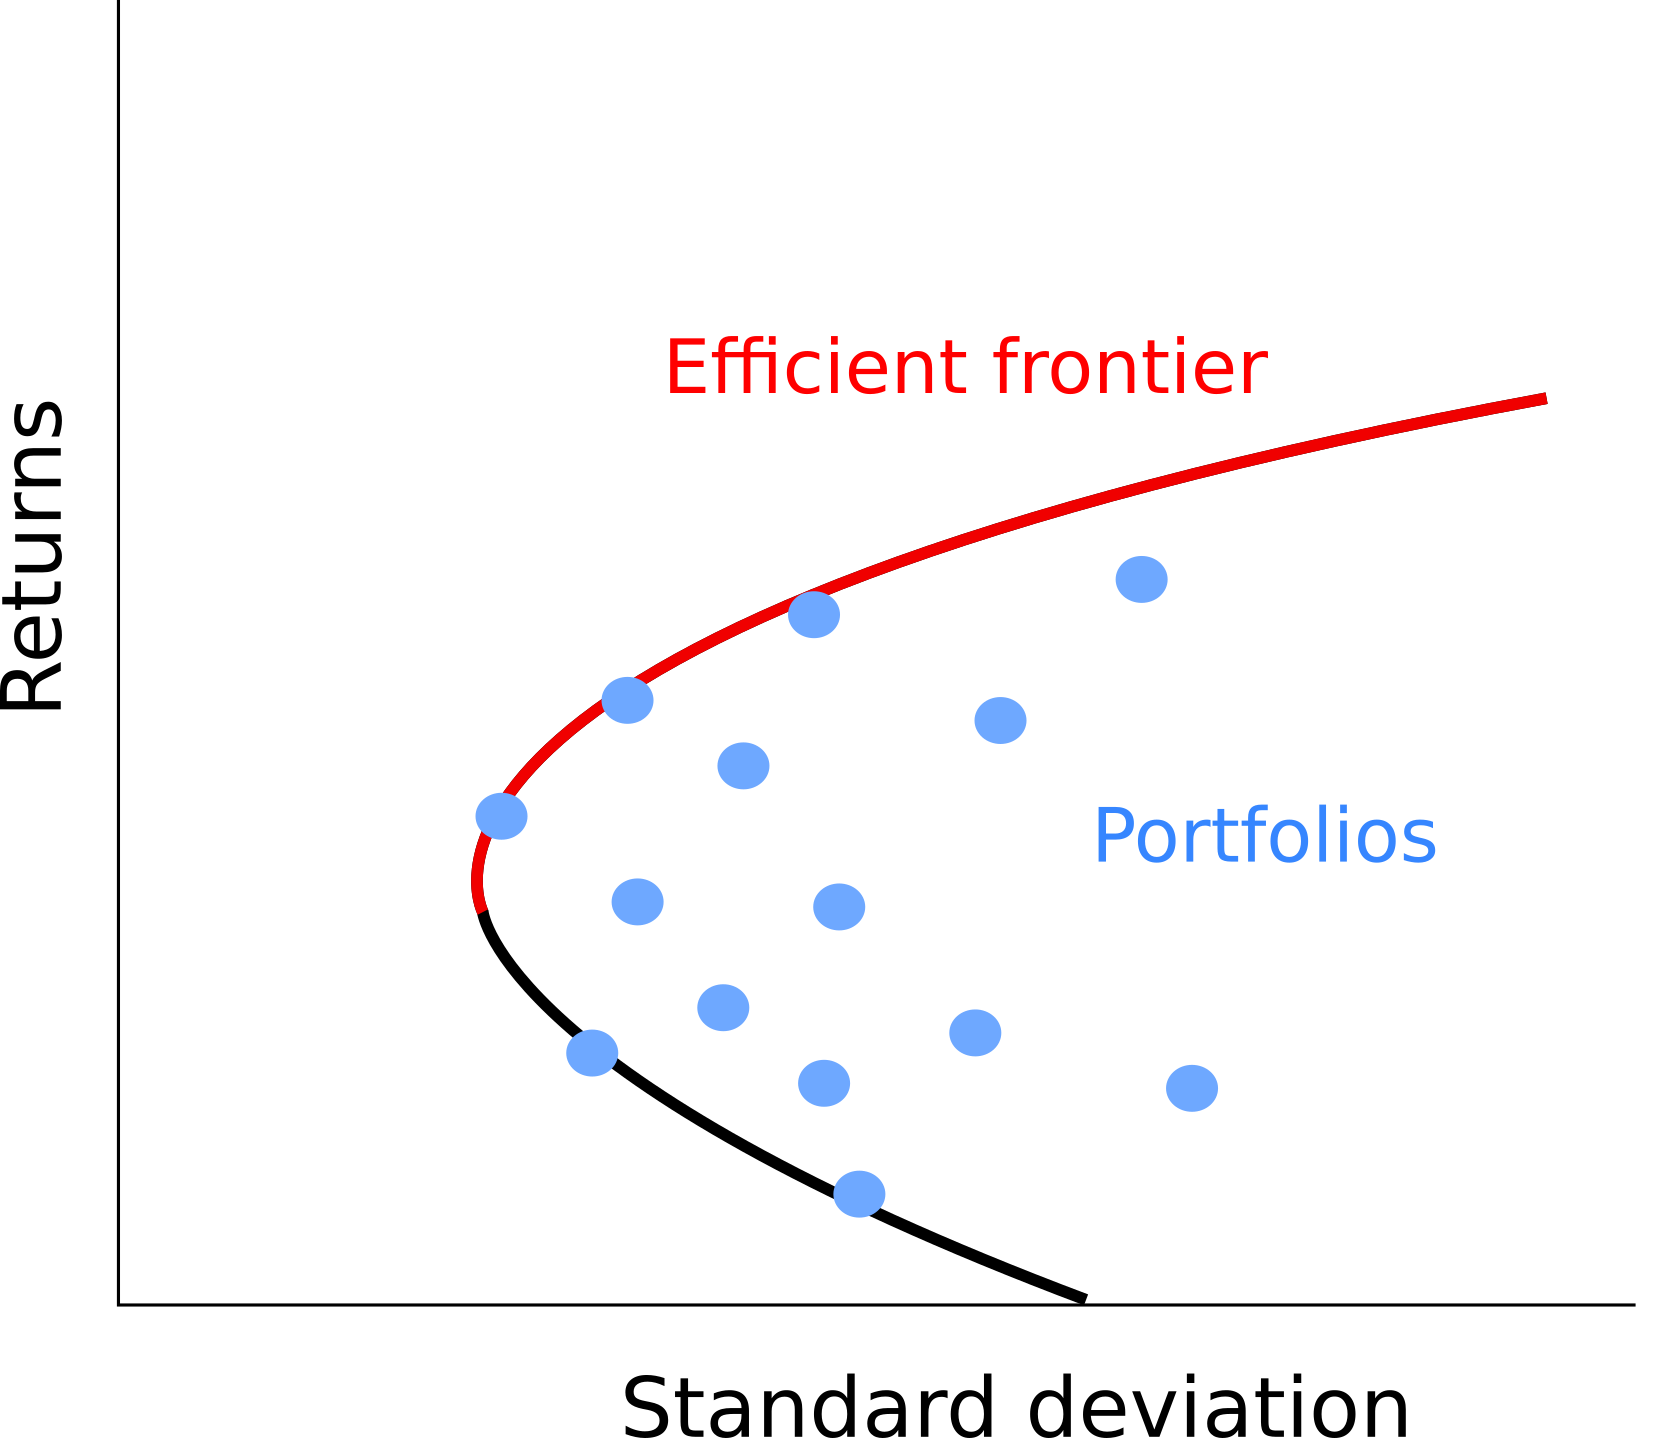
MPT portfolio optimization
Portfolio optimization based on Modern Portfolio Theory (MPT) offers investors a framework to maximize returns while minimizing risk by diversifying their investments across different asset classes. In this post, I give a practical demonstration of how simulation can be used to find an efficient portfolio.

Automatic sorting of pictures by location
I like to make a backup of my pictures on an external drive and keep them tidy by sorting them in a separate folder for each country. In this post I share a small script to automate this process and showcase how to do reverse geocoding offline.

What to visit in Rome
I often get asked what to visit in Rome by friends and colleagues planning a trip. In this post I summarise my recommendations and share a few tips for the aspiring tourists.

Updates to package countries
Version 0.2 of package countries is out. This article is a short description of some of the new functions.
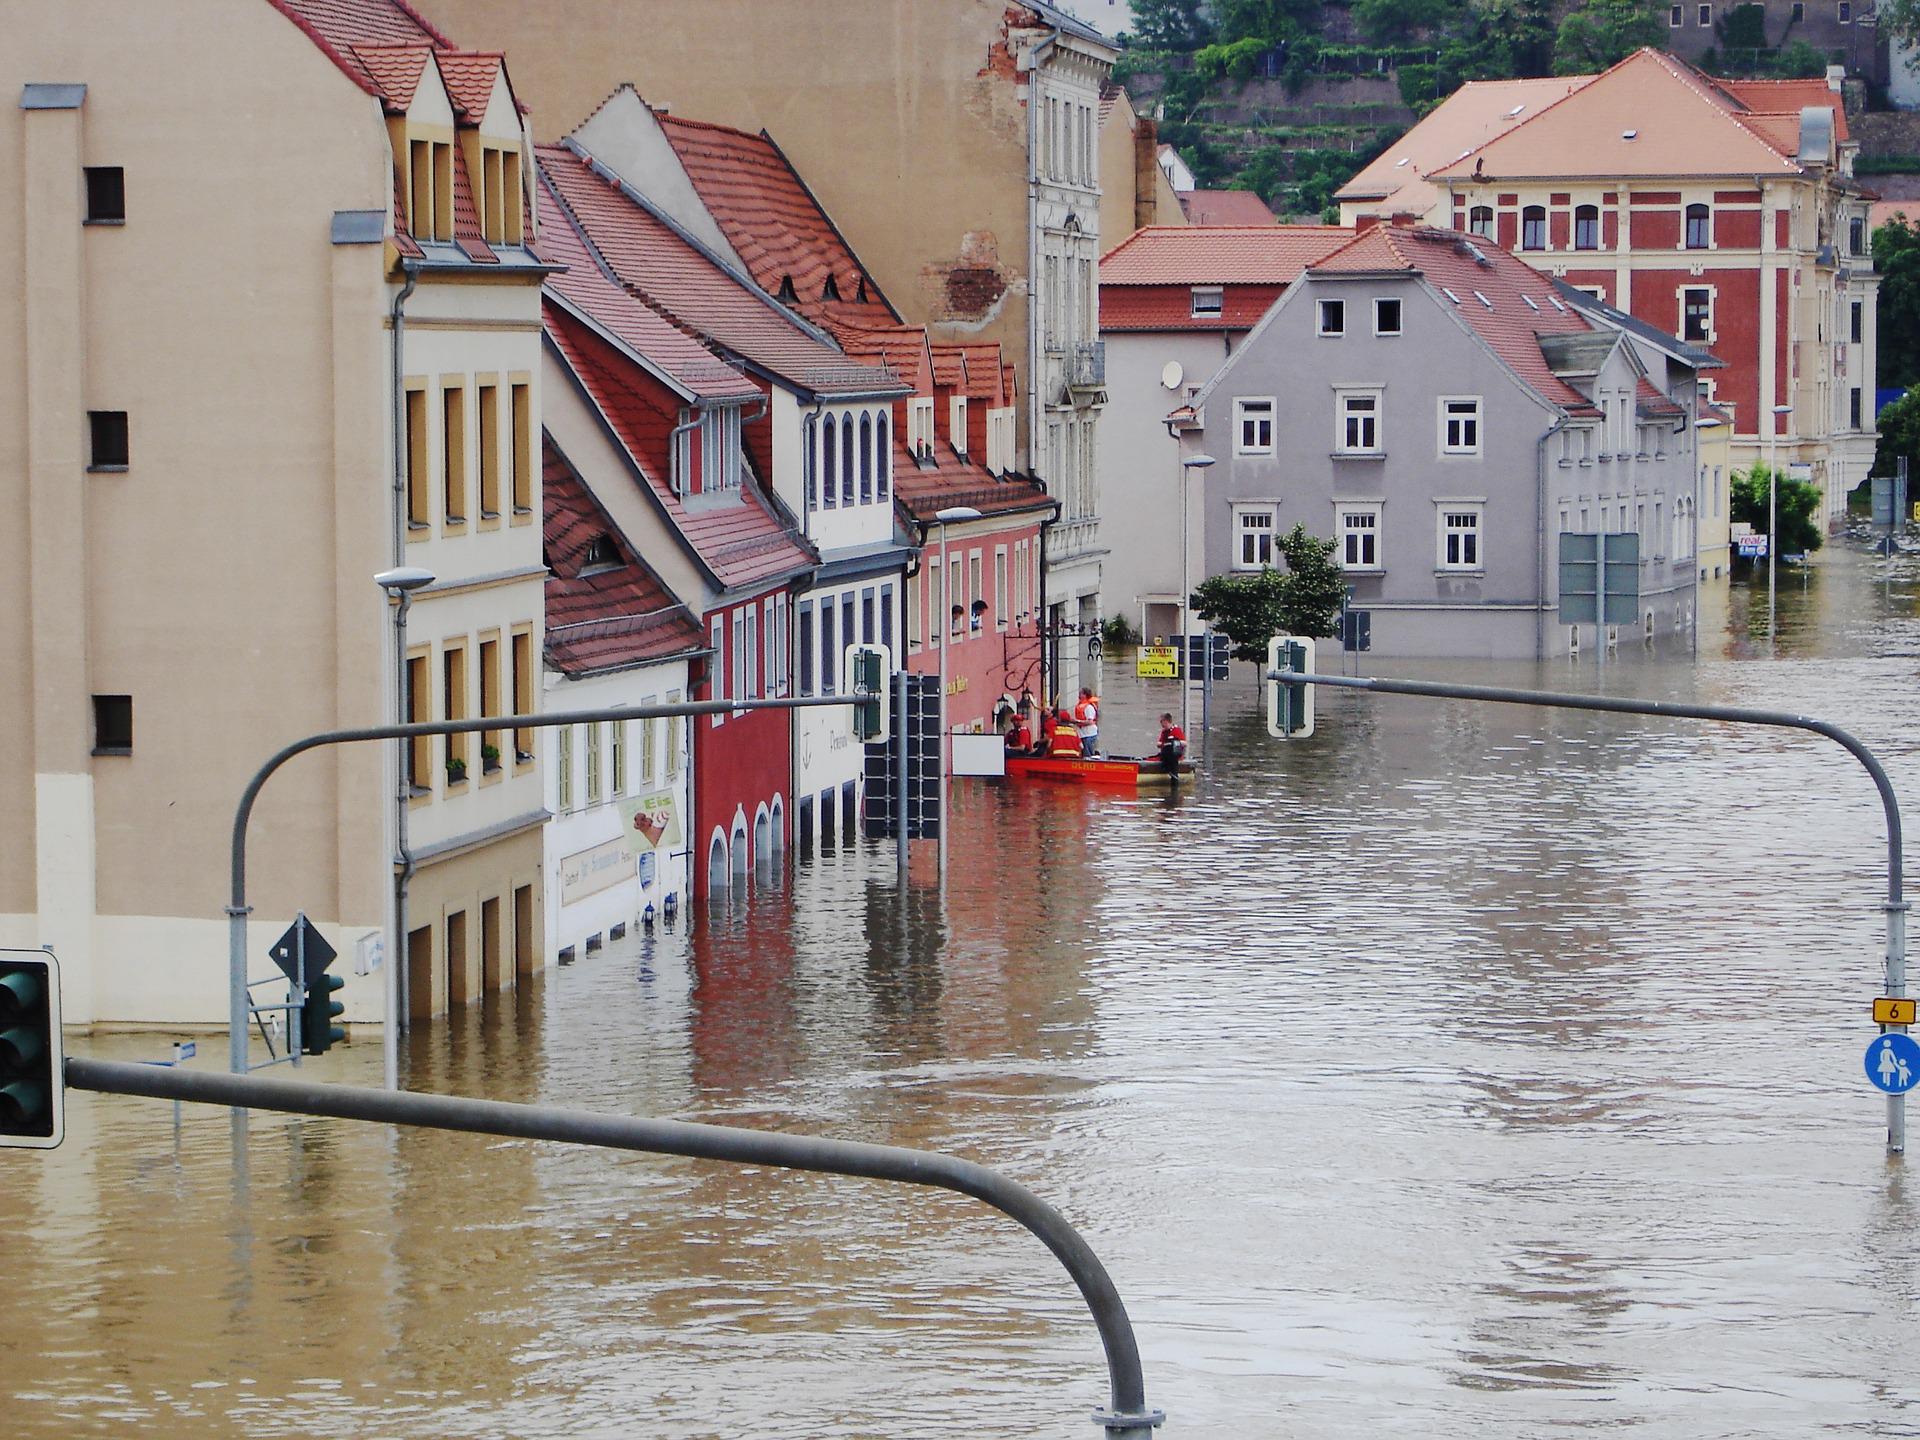
A brief introduction to natural hazard risk analysis
This article is a quick guide on the basic steps involved in natural hazard risk analysis. It briefly touches on some of the most common steps: geocoding, hazard maps, damage curves and climate projections. I demonstrate how R can be used to assess exposure of assets with a simple example on flood risk for presidential palaces around the world.

First version of countries
The first development version of the package countries is now available on Github. This post looks at how the package can be used to work with country names.
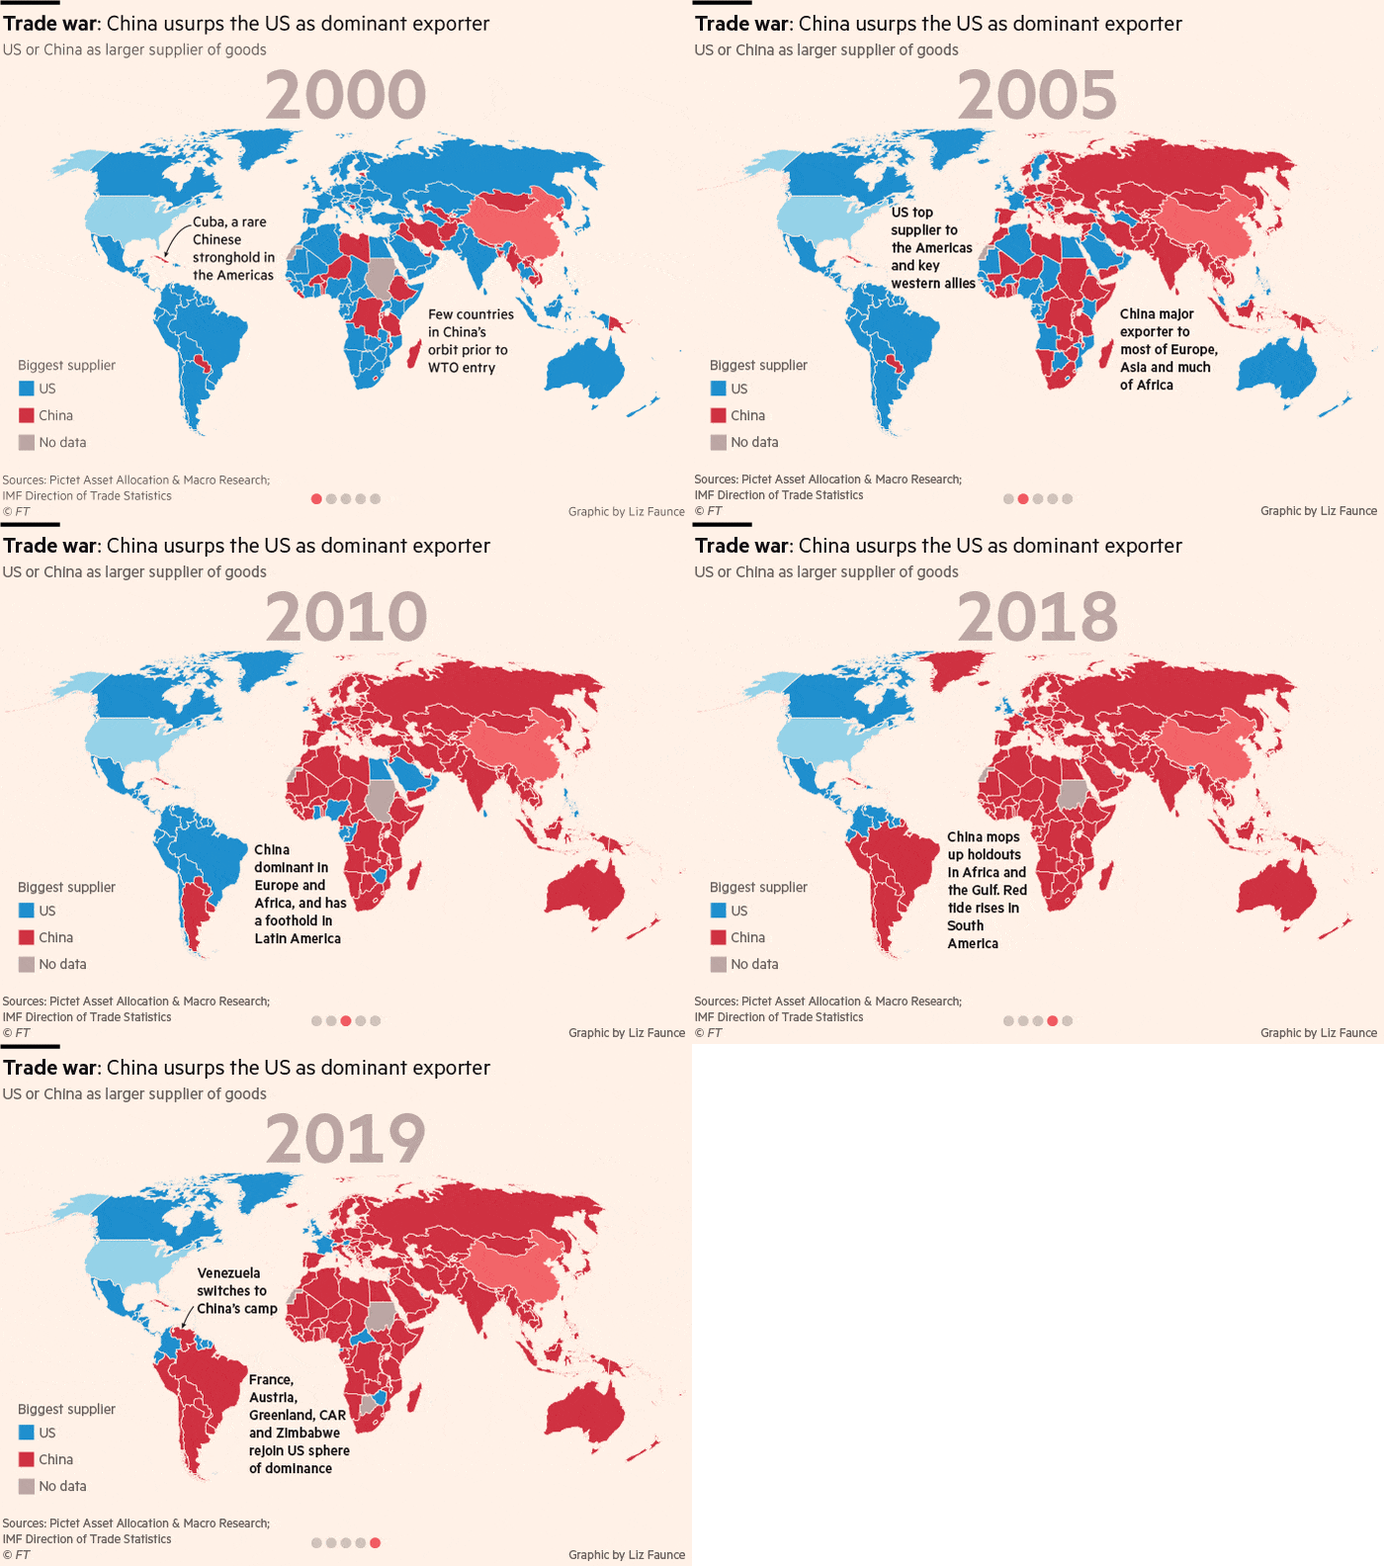
Mishmash of charts
This article is a selection of charts that I prepared over the last three years.
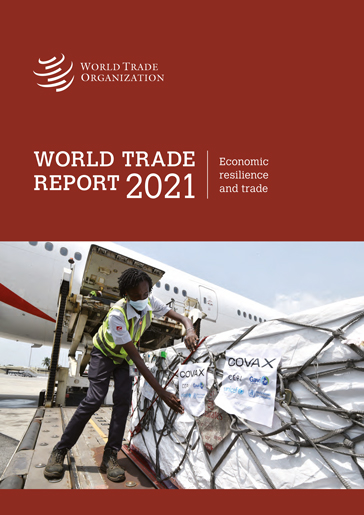
The 2021 World Trade Report is out
I had the honour to contribute to the writing of this year's edition of the World Trade Report, the flagship economic publication of the World Trade Organization. The report explores the role of trade, trade policy and international cooperation in building economic resilience in a world marked by increasing risks. In this article, I briefly outline my contributions on risk trends and policy responses to shocks.

All you need to know about the Paris Agreement ahead of COP26
Only one week left to the official start of the COP26 in Glasgow, in which global leaders will meet to take crucial decisions on climate change. Scientific evidence shows that we are running out of time. If we wish to avoid the worst scenario, it's now or never. What will come out of the summit? Will it be a flop or a success? We don't know yet, but this article will quickly get you up to speed with climate talks.

How has the pandemic affected the office space market?
In this post I have a look at data from the City of London to understand how the pandemic has impacted the office market.

The fascinating world of Voronoi diagrams
In this article I explain what is a Voronoi diagram and why they are amazing

A package for country data
I am working on an R package designed to quickly wrangle, merge and explore country data
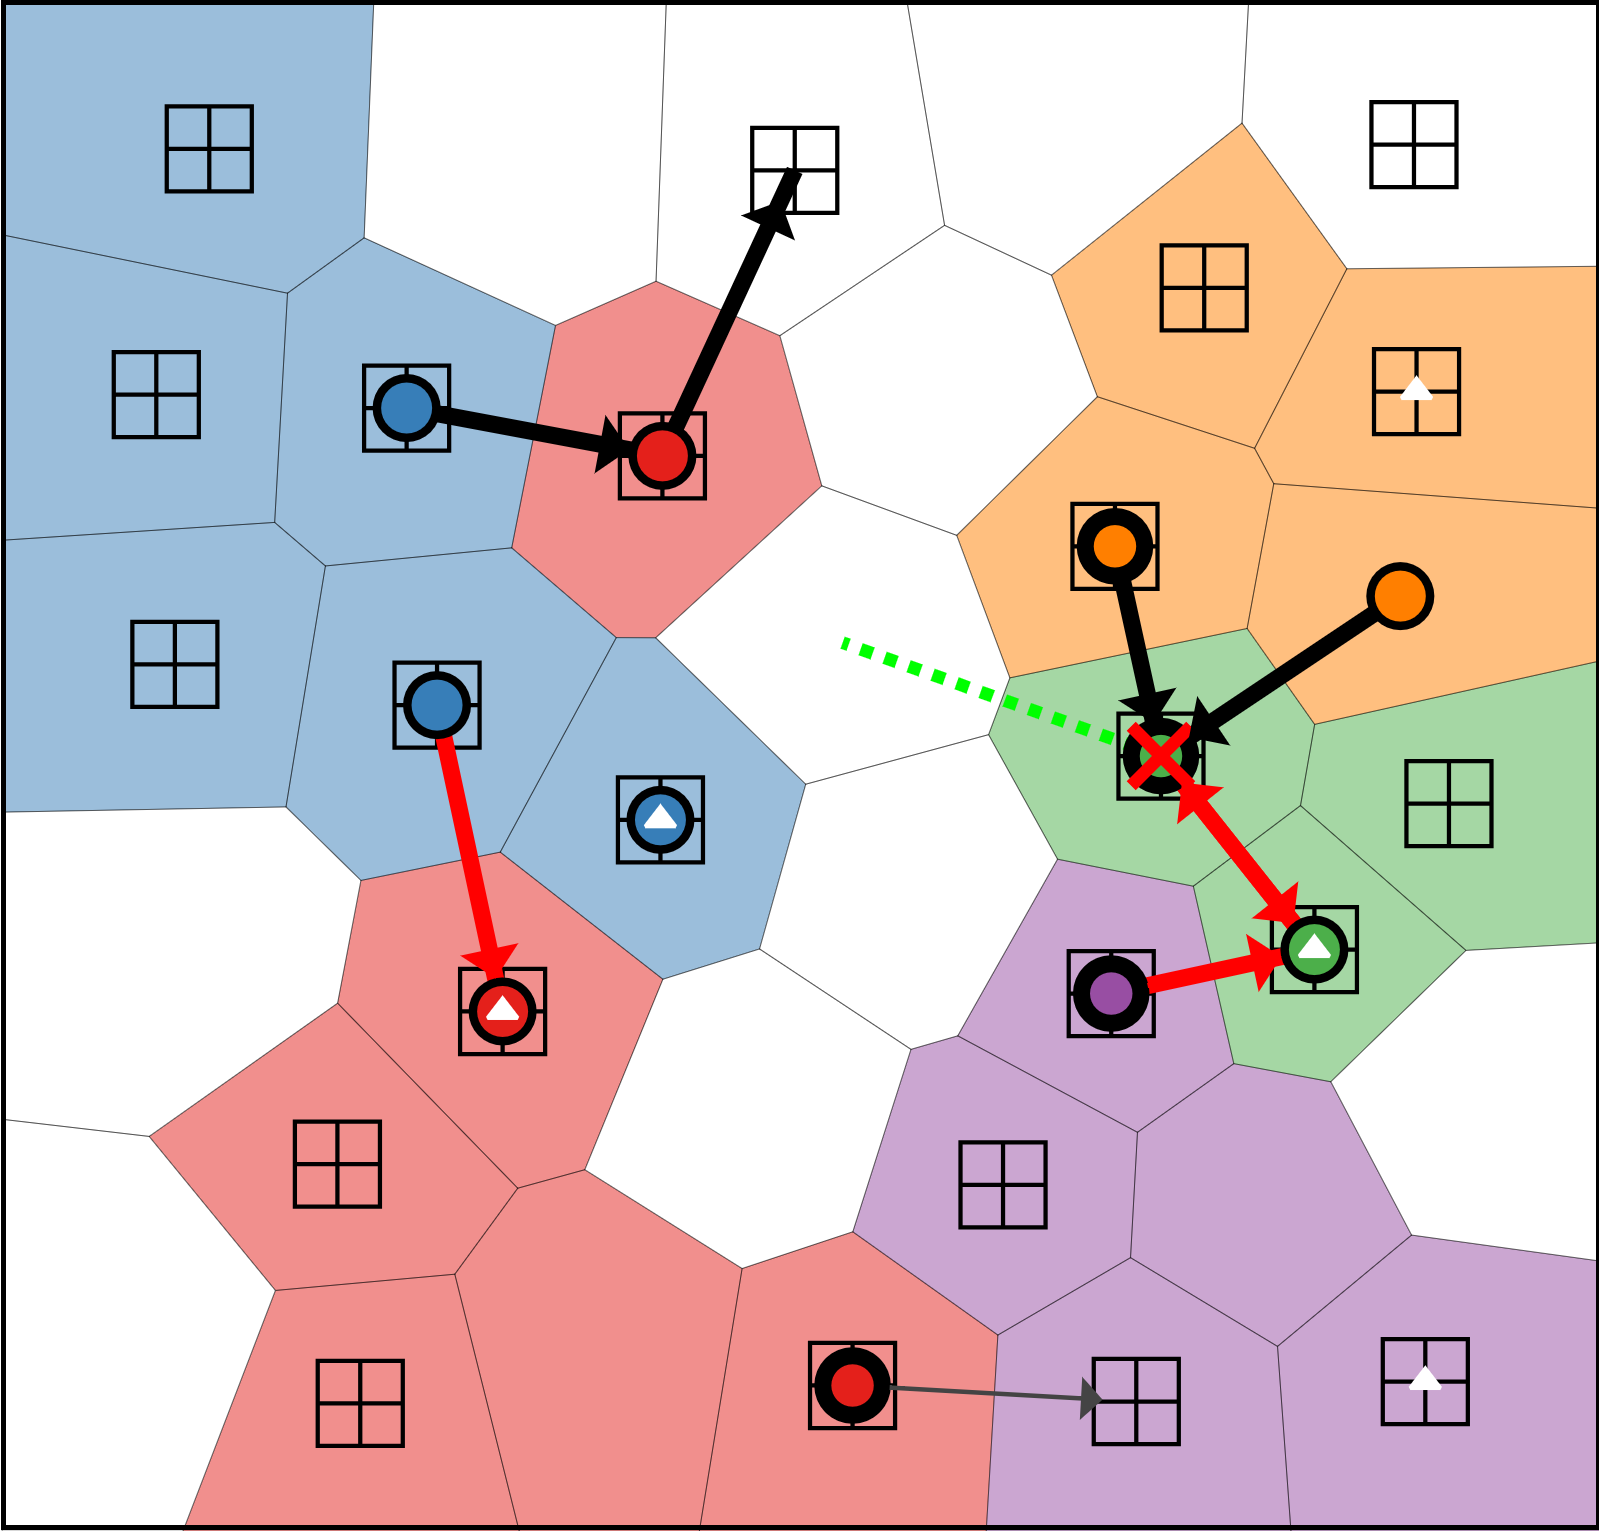
TileMaster: a strategy game in Shiny
I created a small strategy game with RStudios' Shiny platform. If it can run a data dashboard, why not a strategy game?
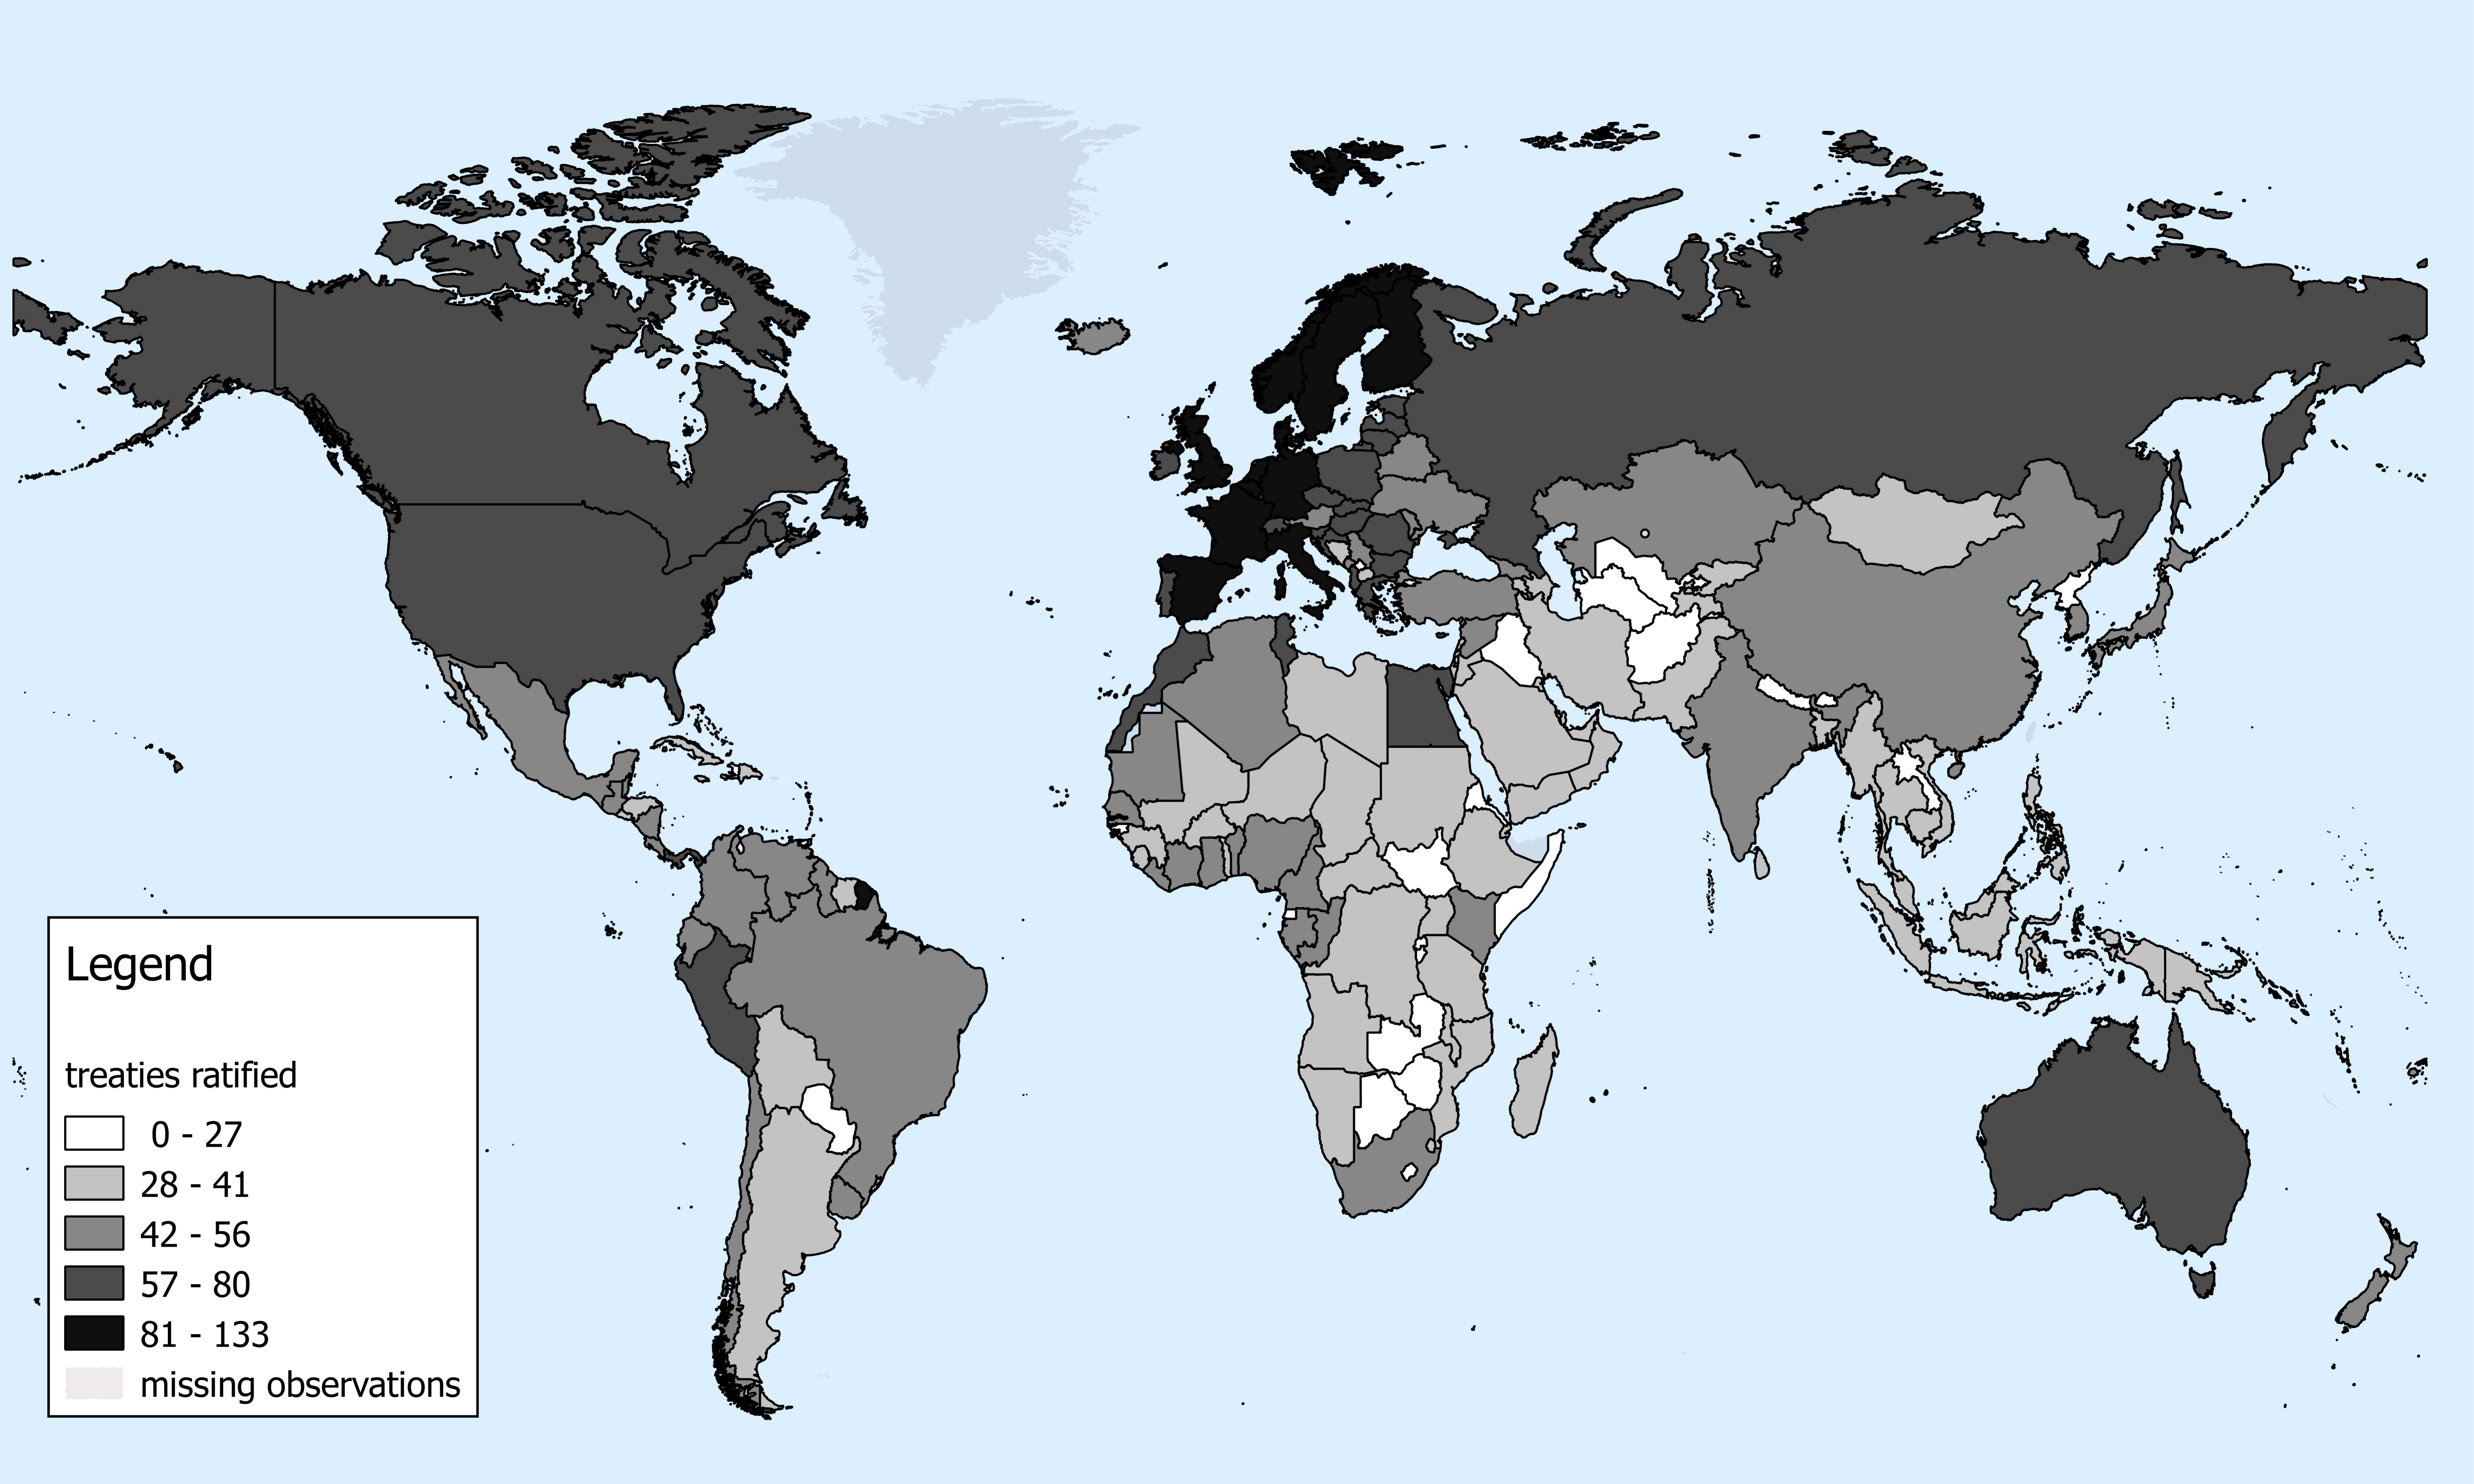
How to increase participation in environmental agreements?
Understanding the determinants of participation in environmental agreements can help us frame more successful agreements. In this article, I discuss the economic theory and empirical evidence on this topic.

Watercolours
A gallery displaying some of the artistic creations of Francesco and Lily
Mappa licita naturale
Mappa di un sistema di licita naturale lungo-corto a bridge